
Struggling to get quality backlinks? Infographic link building is a powerful solution. By creating visually compelling infographics that simplify complex information, you can naturally attract backlinks from authoritative sites.
This innovative strategy boosts your content’s shareability while driving significant improvements in SEO performance.
Also, if you’re feeling overwhelmed by infographic creation, GrowthOG makes it easy. We design eye-catching infographics and handle outreach, helping you quickly boost your SEO success.
Let’s dive in.
What is Infographic Link Building?
Infographic link building is a strategic approach to digital marketing that uses visually appealing infographics to earn backlinks from reputable websites.
These backlinks improve your site’s domain authority and SEO ranking, making it a valuable tool for growing your online presence.
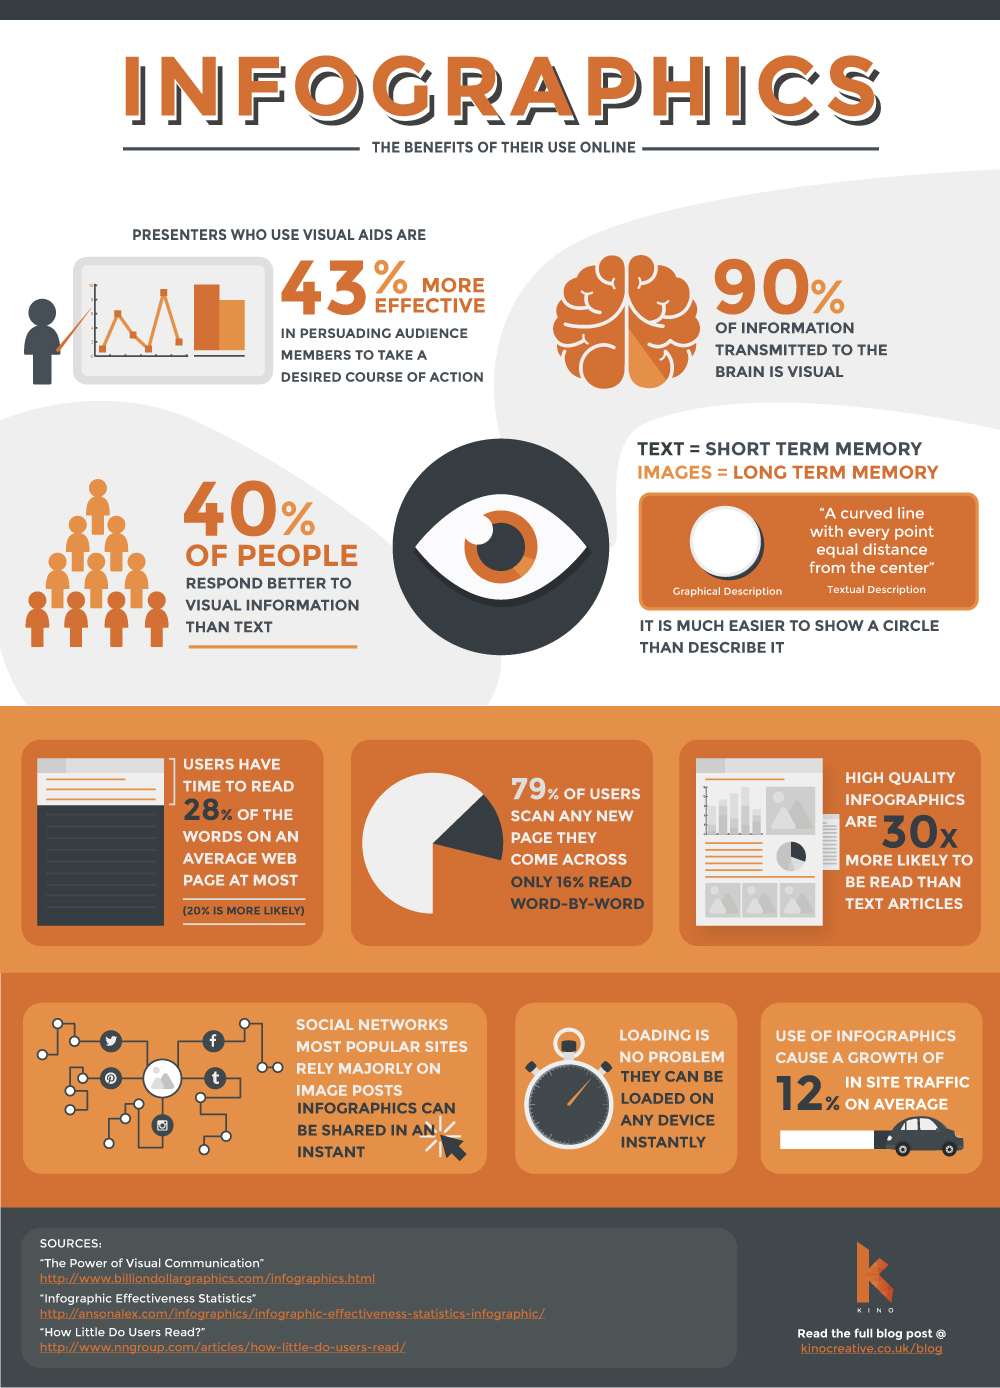
A great representation of data in the form of infographics
This strategy simplifies complex information by turning it into engaging visuals that are easy to understand and share.
Promote your infographic to content creators, bloggers, and industry influencers to boost its visibility and increase the chances of earning valuable backlinks.
How do you earn infographic backlinks?
- Create High-Quality Infographics: Design visually engaging infographics that provide value to your audience. Make sure the data is accurate and useful.
- Promote Your Infographic: Share your infographic with content creators, bloggers, and influencers in your niche for link insertion. Reach out to websites that would find it valuable and offer to have them feature it to get referral traffic.
- Offer Easy Sharing Options: Provide an embed code or a direct link so others can easily share your infographic on their websites or social media.
- Leverage Social Media: Share your infographic across platforms like Twitter, Instagram, and LinkedIn. Use hashtags and tags to help it gain visibility and attract attention from influencers and relevant communities.
- Follow Up: After promoting your infographic, follow up with the websites or influencers to remind them about it and its value to their audience.
Benefits of Using Infographics for Link Building
Here are some unique advantages of infographics for link building to understand their importance.
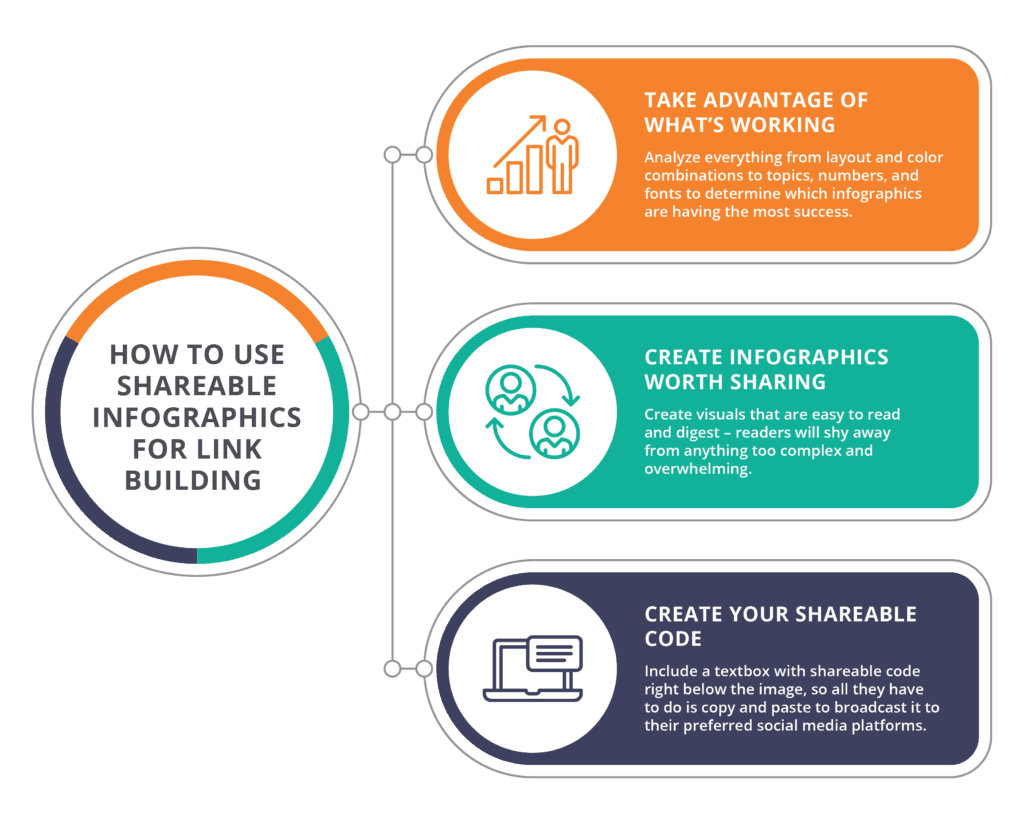
How can you use shareable infographics for link building?
- Increase Engagement: Infographics are visually appealing, which grabs attention and keeps users engaged longer. They present information in a clear, concise format, making it easier for audiences to understand and retain complex data.
- Attract More Links and Shares: Infographics are more likely to be shared and linked than text-based content. Their visual appeal and informative nature make them highly shareable on social media, blogs, and websites.
- Boost SEO with High-Quality Backlinks: Infographic link building helps you attract backlinks from authoritative websites, which in turn boosts your SEO. High-quality backlinks are crucial for improving search engine rankings.
Is Infographic Link Building Challenging?
Infographic link building can be challenging, especially due to the need for creativity and design skills.
Here’s why:
- Creative and Strategic Effort: To create visually appealing and informative infographics, you need careful planning and a strategic approach to communicate key messages effectively. It must be clear, engaging, and accurate to attract attention.
- Research and Data Visualization: Successful infographic link building relies on thorough research and turning data into easy-to-understand visuals. This step is crucial to ensure the content resonates with your audience and provides real value.
- Promotion and Outreach: To gain valuable backlinks, you must create high-quality infographics and promote them strategically. Outreach to relevant influencers, bloggers, and websites is essential to increase visibility and drive traffic.
- Performance Tracking: Continuously tracking and analyzing your campaign’s performance allows you to refine your approach and improve future results. This ensures that the infographics are shared and result in meaningful backlinks.
The good news?
GrowthOG can help you. We have a history of assisting clients to choose the right type of infographic based on their industry and campaign objectives, ensuring better results.
With our professional guidance, you can create informational infographics that effectively attract backlinks and improve your search engine optimization strategy.
Types of Infographics
Understanding the different types of infographics can help you choose the best format to convey your message and attract valuable backlinks.
Statistical infographics
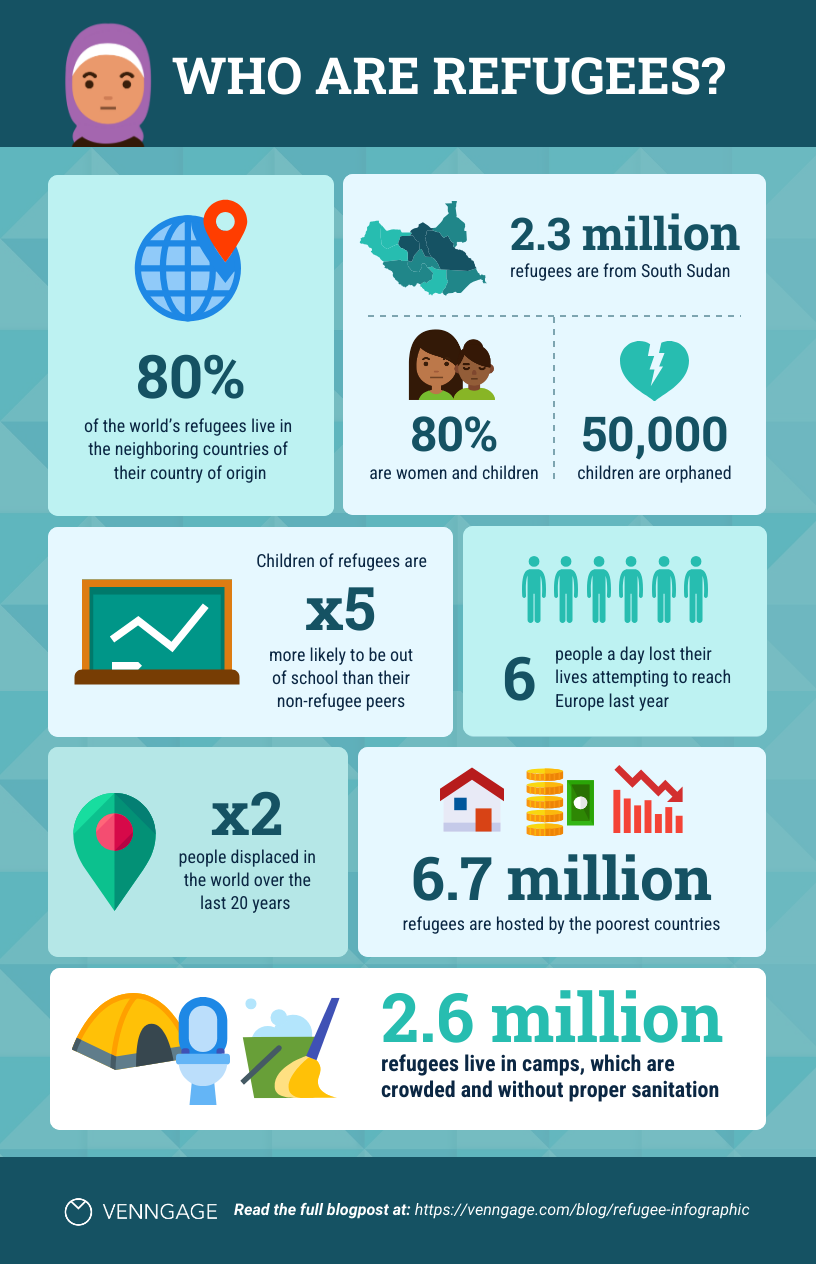
Example of statistical infographics
Statistical infographics visually present numerical data and statistics, offering a clear and engaging way to convey trends, comparisons, and insights. They are ideal for distilling complex datasets into easily digestible visuals highlighting key takeaways. This includes for:
- Business Reports: Showcase quarterly performance metrics, revenue growth, or market trends
- Education: Simplify statistical concepts for students or visualize survey results for academic research
- Marketing: Present consumer behavior insights or campaign results to stakeholders
A data packed infographic should be accessible and engaging for audiences.
For this reason, pay attention to visual representation, such as bar charts, pie charts, and line graphs. These elements can simplify complex information, make it easier to interpret and remember.
Ideal for:
- Saving time breaking down lengthy information
- Supporting data-driven decision-making
- Offering a shareable and impactful way to communicate key statistics
Process infographics
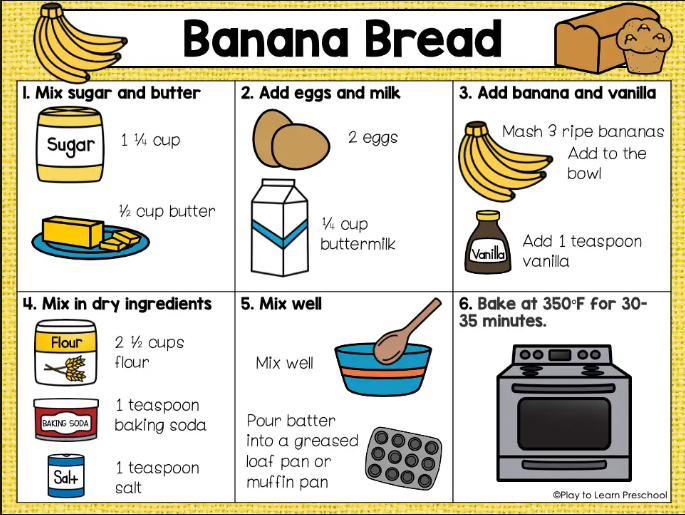
Look how engaging this process infographic looks
Process infographics visually outline a sequence of steps or stages in a process, providing a clear roadmap for completing tasks or understanding workflows.
Their applications include for:
- Marketing: Explain campaign strategies or content creation workflows
- Education: Illustrate learning modules or problem-solving techniques
- Customer Support: Provide clear instructions for product assembly or troubleshooting
By visually mapping out steps, they provide a quick reference that’s easy to share, implement and revisit, saving time and boosting productivity.
Ideal for:
- simplifying complex procedures
- ensuring information is easy to follow.
- making them accessible to a broader audience
Timeline infographics
Timeline infographics visually represent events, milestones, or data points in chronological order, offering a clear and engaging way to narrate a sequence of occurrences. They are perfect for showcasing progress, highlighting historical events, or outlining future plans.
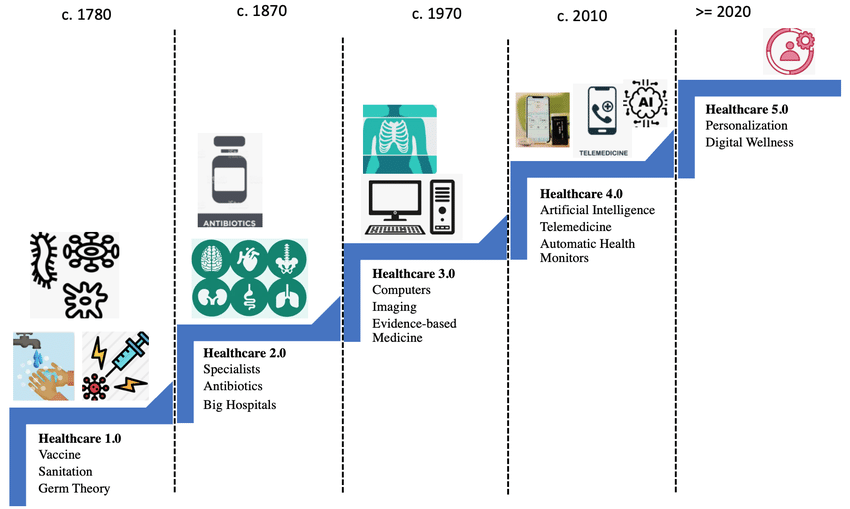
Timeline infographic for healthcare evolution
Their applications include for:
- Business: Illustrate company milestones, product development timelines, or project schedules
- Education: Map out historical events, scientific discoveries, or literature chronologies for students
- Marketing: Display campaign rollout plans or the evolution of a brand
Timeline infographics bring order to complex sequences, making them easy to understand at a glance. By combining visuals like icons, lines, and descriptive text, they help audiences follow a narrative seamlessly.
Ideal for:
- providing an effective way to track progress, set goals
- presenting information in a visually compelling format
- combining chronological elements to show a complete story
Geographic infographics
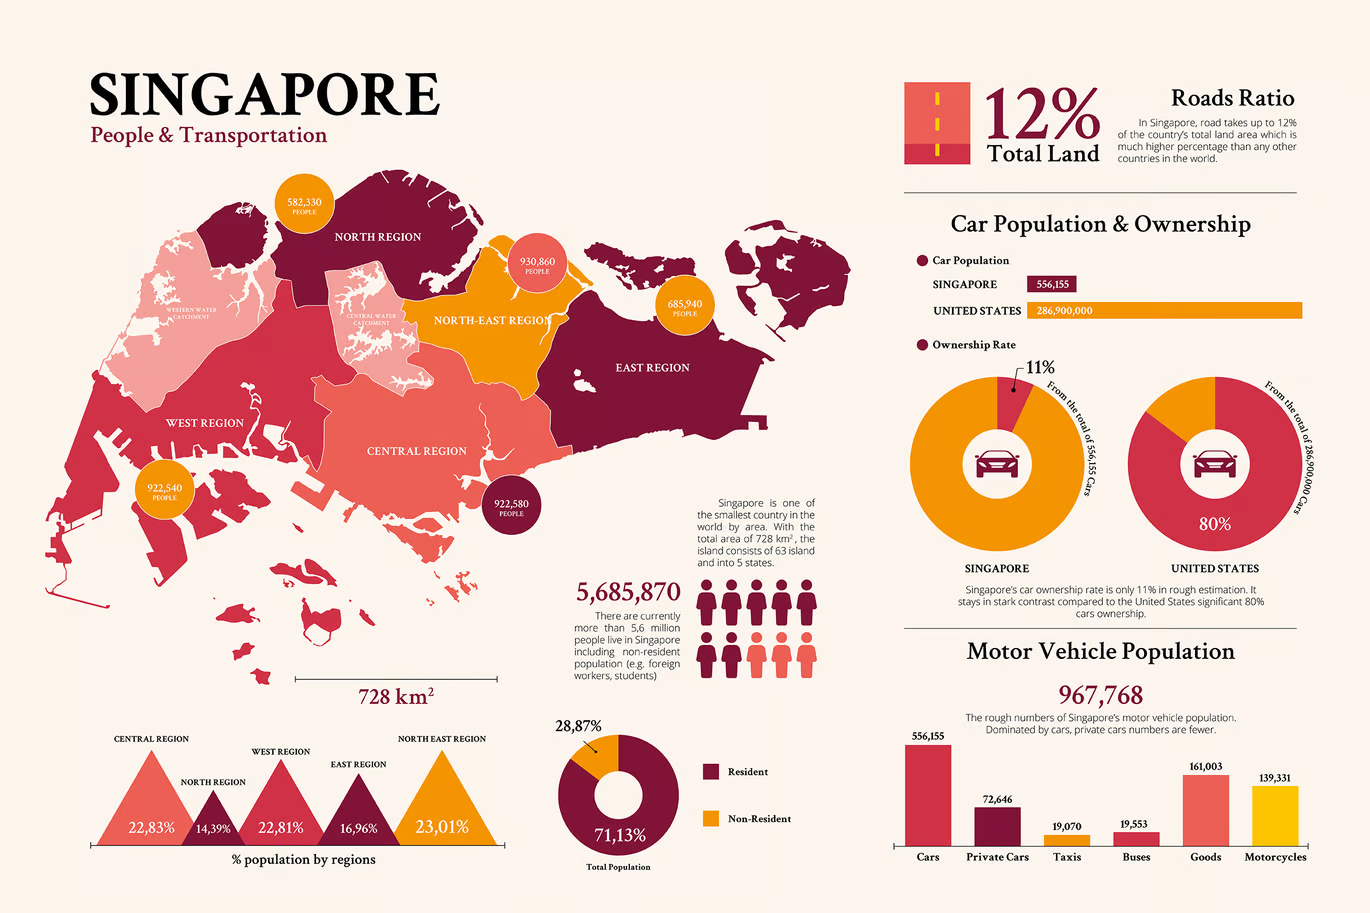
An example to understand geographic infographics
Geographic infographics use maps and spatial data to visually communicate location-based information, making complex geographic trends easier to understand. By integrating data with maps, they offer a compelling way to highlight regional disparities, trends, or opportunities.
Here are some applications of geographic infographics:
- Environmental: Illustrate global carbon emissions, renewable energy use, or deforestation hot spots
- Business: Showcase market penetration, regional sales performance, or international expansion strategies
- Education: Explain migration patterns, natural disaster impacts, or geographic demographics
For instance, visualizing population density or internet access by region helps audiences grasp disparities at a glance.
Ideal for:
- making location-based data more accessible and engaging
- simplifying complex spatial data using heat maps, pin-marked maps, etc.
- decision-making and advocacy
Hierarchical infographics
Hierarchical infographics organize information into structured levels of importance or rank, presenting data in a clear and logical framework. They often use pyramid, tree, or flowchart designs to simplify complex hierarchies.
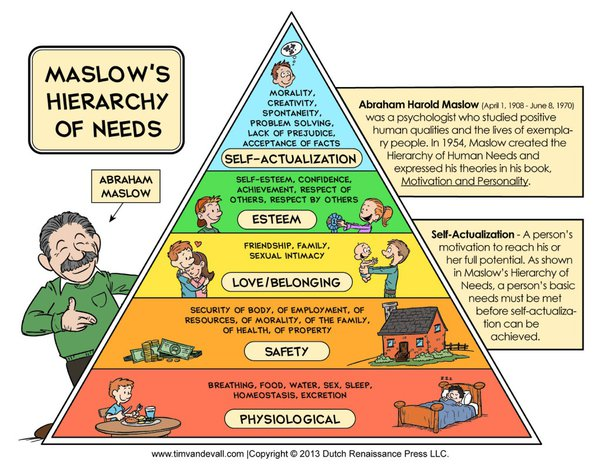
Maslow’s hierarchy of needs is a great example of this
Their uses include:
- Corporate Structure: Depict organizational charts, showing roles and reporting lines from top-level executives to staff.
- Educational Models: Visualize concepts like Maslow’s Hierarchy of Needs or Bloom’s Taxonomy for students.
- Business Strategies: Outline decision-making frameworks or priority levels in project management.
Hierarchical infographics clarify complex systems by breaking them into digestible layers. Their intuitive structure allows audiences to identify relationships, authority levels, or priorities quickly.
For example, presenting a company’s management structure in a pyramid format highlights leadership roles while efficiently guiding viewers through each level.
Ideal for:
- presentations
- training materials
- decision-making processes
Comparison infographics
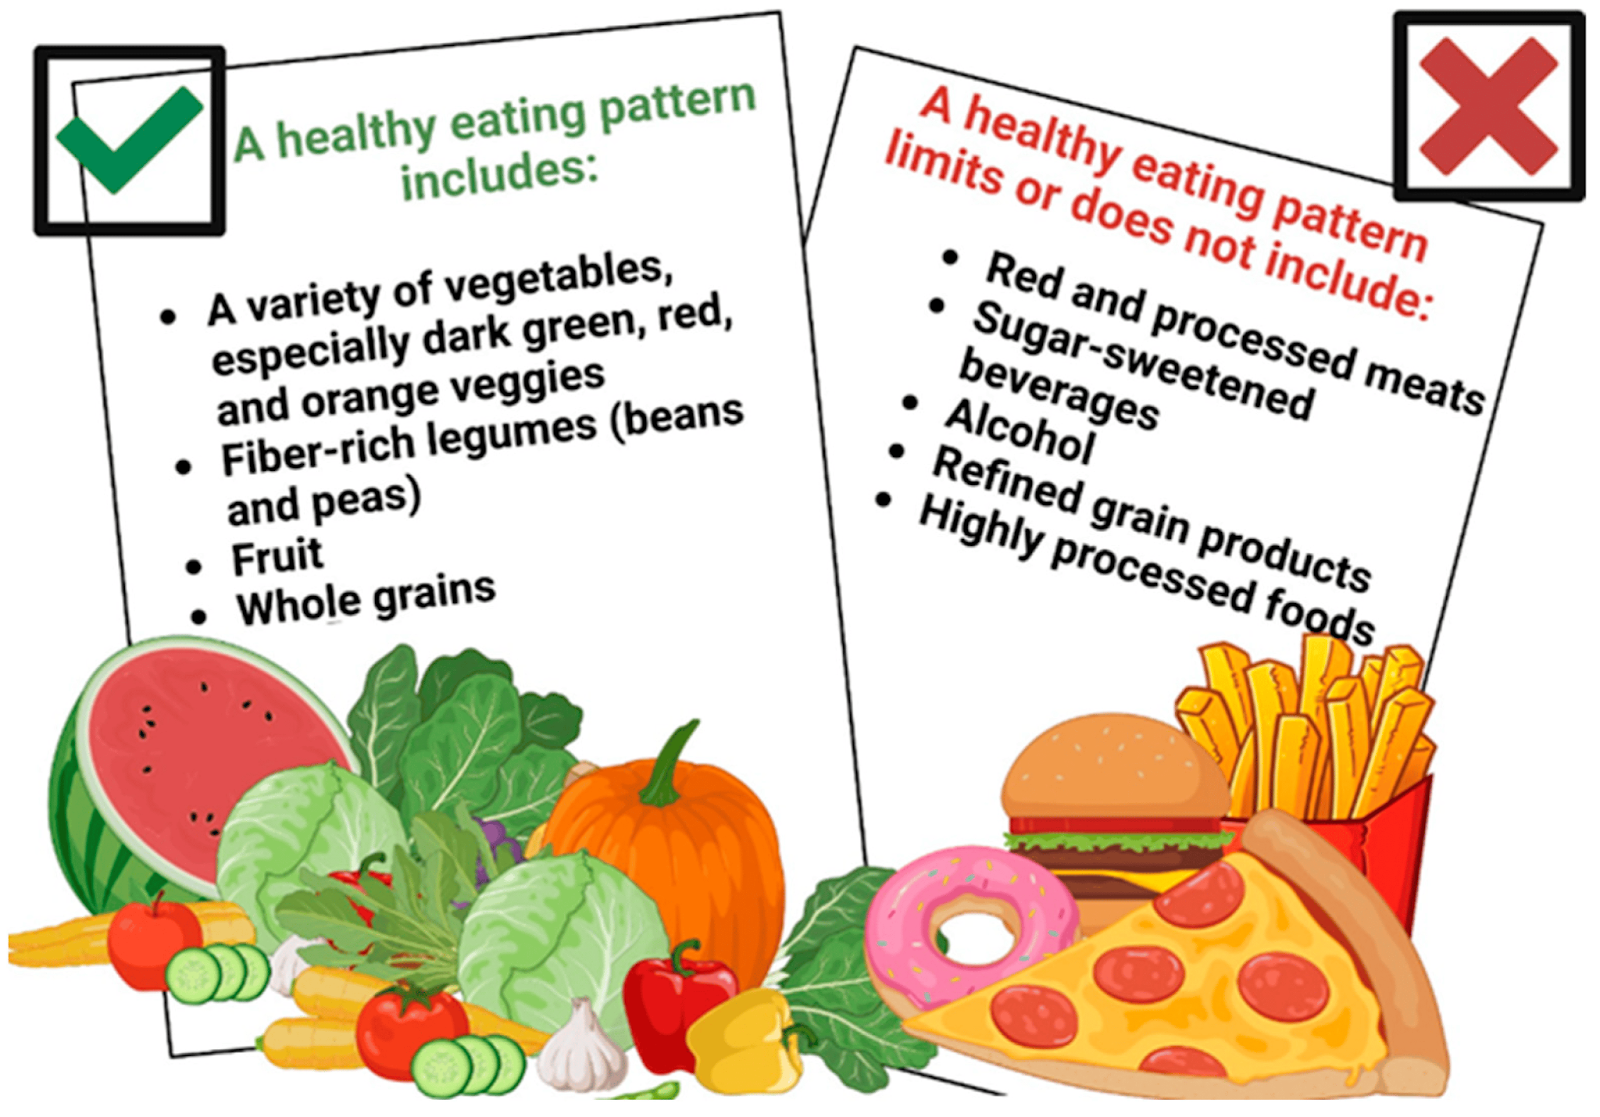
A comparison infographic explaining healthy and unhealthy eating patterns.
Comparison infographics visually contrast two or more options, allowing viewers to assess similarities and differences. By presenting information side by side, they help simplify decision-making and emphasize key distinctions.
Here are some famous uses of comparison infographics:
- Product Comparisons: Highlight features, pricing, and benefits of competing products (e.g., smartphone models, software packages)
- Service Analysis: Compare offerings from different companies to help customers make informed choices
- Before-and-after insights: Showcase progress or transformations in areas like fitness, home improvement, or technology upgrades
Comparison infographics streamline complex evaluations, making them accessible and visually engaging. They are particularly effective in marketing, where they can influence purchasing decisions by showcasing advantages clearly.
For example, contrasting two subscription plans side by side with details like cost, features, and limitations helps users decide which one fits their needs best.
Ideal for:
- relevant blog posts
- sales presentations,
- social media campaigns
Creating a Compelling Infographic
To craft an infographic that captures attention and communicates your message effectively, follow these key steps.
Start with a concept and research data
The first thing to do is identify the core message or purpose of your infographic. This will guide your content and design choices.
Then, collect accurate and up-to-date data from credible sources to support your concept. Focus on standout statistics or trends that will engage your audience. Identify points that are both interesting and valuable.
Group related data logically to ensure your infographic has a smooth flow. Categorize your information in a way that’s easy for your audience to follow.
For example, if your infographic is about “The Importance of Drinking Water,” the goal is to highlight the health benefits. You could gather data such as:
- “Drinking enough water can increase your energy by 20%.”
- “Over 60% of your body is made up of water.”
- “Drinking water helps improve skin complexion and digestion.”
Organize the data into sections like “Why Hydration Matters,” “How Water Helps Your Body,” and “The Right Amount of Water to Drink.” Use icons like a water bottle, an energy symbol, and a happy face with clear, concise text to make each point easy to grasp.
Use visual elements to communicate your data
Here’s how to do this:
- Incorporate Charts and Graphs: Use bar charts, pie charts, and line graphs to simplify complex data. These visuals help you highlight key statistics and trends clearly.
- Utilize Icons and Illustrations: Include icons that represent key concepts or data points, making the infographic visually engaging and easy to understand. Icons can help break down information and guide the viewer’s attention.
- Apply Color and Contrast: Use colors strategically to differentiate sections or data points. Ensure there’s enough contrast between text and background to improve readability.
- Create Visual Hierarchy: Arrange visual elements so that the most important information stands out. Use size, color, and positioning to guide the viewer’s eyes through the content in a logical flow.
- Keep It Simple: Avoid overcrowding the design with too many visuals. Stick to clean, simple visuals that complement the message without overwhelming the viewer.
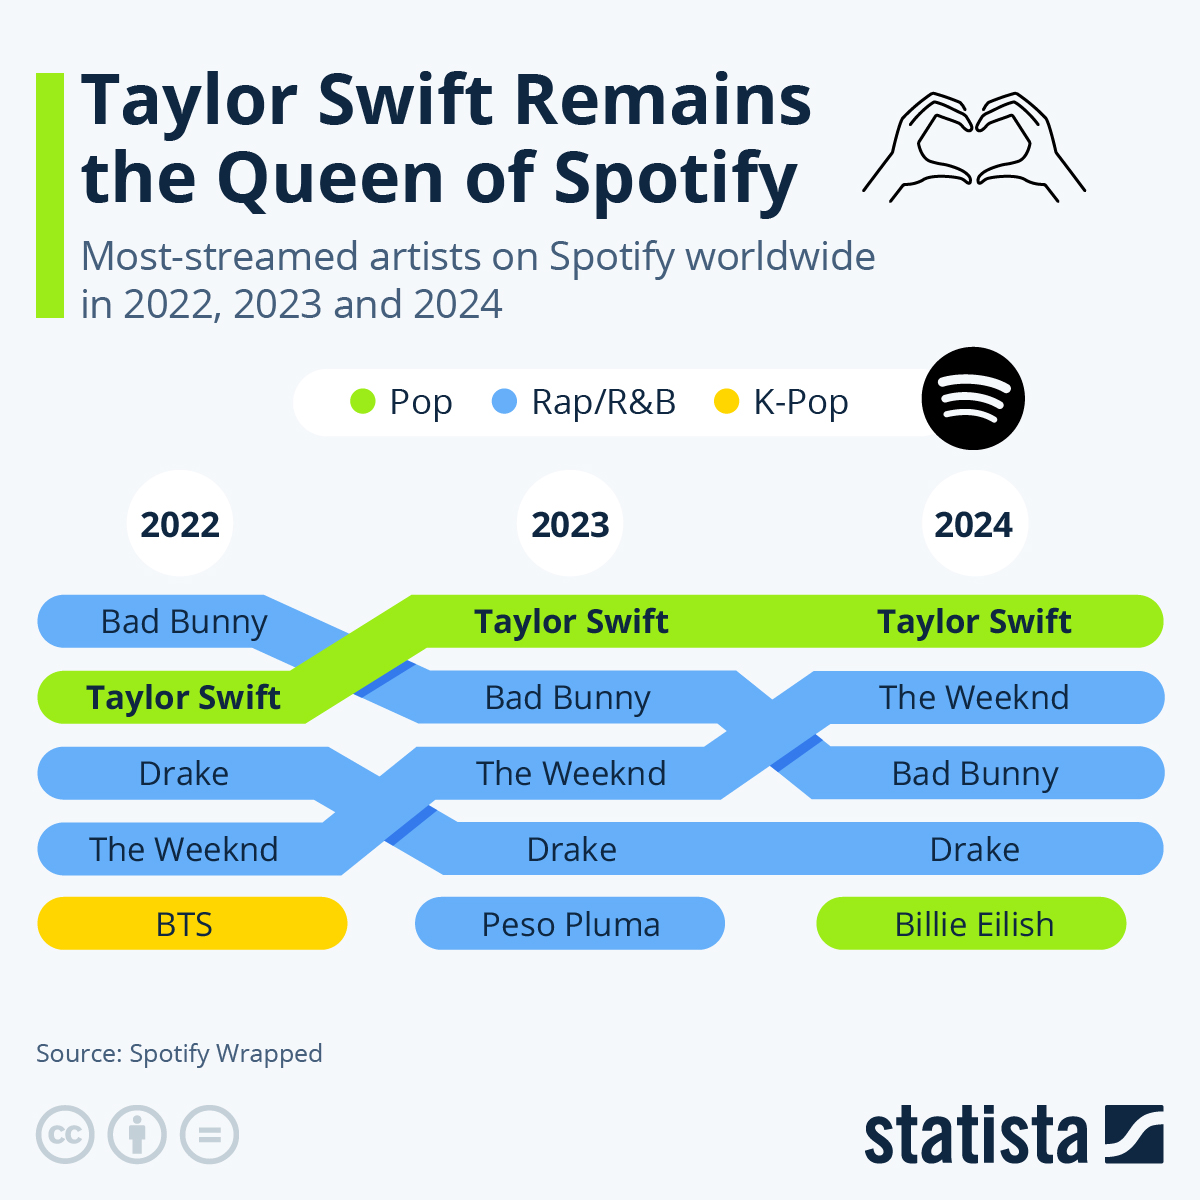
Spotify Wrapped 2024 infographics highlight global music trends, with Taylor Swift as the most-streamed artist and Espresso by Sabrina Carpenter leading top songs. The visuals emphasize genre dominance, such as pop and R&B, and collaborations that define “Music Evolution.”
Clear charts showcase trends like artist rankings and listener behavior, making complex data engaging and easy to understand.
Create a compelling story
Begin your infographic with a captivating hook in the form of a fact or statistic that immediately grabs attention. This could be surprising or relevant to your audience.
Present key insights in a logical sequence, guiding the viewer through the information step by step. Each section should flow naturally to the next, leading the audience deeper into the story.
Conclude your infographic with a clear call to action or a summary of the main message. This should encourage the viewer to take the next step or reflect on the information presented.
Design to captivate your audience
The key points to keep in mind here are:
- Maintain a clean layout: Keep your design simple and uncluttered, focusing on the essential information. Avoid overcrowding the infographic with too many visuals or text, as this can overwhelm the viewer.
- Use contrasting colors: Apply contrasting colors to differentiate between sections or categories, making it easy for the viewer to navigate and understand the content. Ensure the colors align with your brand for a cohesive look.
- Select readable typography: Choose fonts that are easy to read, even on smaller screens. Use bold headers to emphasize key points and smaller text for supporting details. Ensure there is enough spacing between text and elements to enhance readability.
- Highlight key points: Use larger fonts or bolder text for headings, subheadings, and essential statistics. This will help you highlight key information and draw attention to the most crucial parts of your infographic.
- Use relevant keywords: Include essential keywords related to your topic in the file name and alt text. This helps search engines index your infographic and improves its visibility.
- Keep it descriptive and clear: Ensure that the file name and alt text clearly describe the infographic’s content in a natural, easy-to-understand way. This boosts SEO while making your infographic accessible.
- Avoid keyword stuffing: Don’t overuse keywords. Instead, focus on using them in a way that accurately reflects the infographic’s content.
Pro-tip: At GrowthOG, we combine expert data visualization and storytelling to create infographics that look great and boost your SEO. Our designs are optimized with relevant keywords and structured for maximum engagement, ensuring your content ranks higher and effectively communicates your message.
Launching an Infographic Link Building Campaign
To successfully launch an infographic link building campaign, follow these key steps to ensure your content reaches the right audience and generates valuable backlinks
Choose your infographic type and topic
Select the correct type of original infographic based on the data you want to present. For example:
- Statistical Infographics: Ideal for showcasing numbers, data, and trends.
- Process Infographics: Best for outlining steps or stages in a process.
- Comparison Infographics: Perfect for contrasting different options or ideas side-by-side.
Choose a topic that resonates with your target audience. Consider their interests, needs, and pain points. Ensure the topic is timely and valuable to the people you’re trying to reach, whether it’s related to your industry or a current trend.
Conduct research and gather data
Ensure that the data you collect comes from reliable and reputable sources, such as industry reports, government publications, trusted studies, or expert opinions.
Select data that directly supports your infographic’s message and aligns with your chosen topic. Only include information that adds value and insight to your audience.
It’s also important that your data is current and reflects the latest trends, developments, or statistics to maintain the relevance and credibility of your infographic.
Finally, find compelling statistics or data points that will grab your audience’s attention. Focus on surprising or thought-provoking facts that make your infographic more engaging.
Create a high-quality infographic
To do this, you must:
- Focus on Clarity: Design a clean and simple layout that makes it easy for viewers to understand the information. Use clear headings, concise text, and well-organized sections for your infographic content to guide the reader through the content.
- Integrate Visual Appeal: Incorporate eye-catching visuals such as icons, illustrations, and charts that complement the data and make the infographic more engaging. Use a consistent color palette and typography that align with your brand and enhance readability.
- Highlight Key Points: Use larger fonts, bold colors, or call-out boxes to make important information stand out. This helps you communicate your core message effectively.
- Keep It Concise: Avoid overwhelming the viewer with too much information. Focus on key data points and insights and present them in a way that’s both informative and easy to digest.
- Make It Shareable: Ensure your infographic is optimized for social sharing. Keep the file size manageable, and make it mobile-friendly so viewers can easily share it across platforms.
Launch your outreach campaign
Here are some easy tips to follow:
- Research and compile a list of blogs, influencers, and authoritative websites in your industry that would benefit from your infographic. Look for platforms that align with your topic and audience.
- Craft tailored emails or messages for each target, highlighting the value of your infographic and how it aligns with their content. Make sure to explain why sharing your infographic would benefit their audience.
- Share your infographic across social media channels and tag relevant influencers, brands, or thought leaders to increase visibility and encourage sharing.
- Reach out to journalists, bloggers, and content creators who cover topics related to your infographic. Offer your infographic as a resource or guest post opportunity.
- Actively engage with users who share or comment on your infographic. Respond to questions and thank them for sharing and building relationships that can lead to further backlink opportunities.
At GrowthOG, we implement proven strategies to launch successful infographic campaigns that attract high-quality backlinks from authoritative websites.
Our approach enhances your website’s SEO and increases its visibility, driving more organic traffic and improving your overall digital presence.
Outreach and Distribution
To maximize the impact of your infographic, effective outreach and distribution are crucial for ensuring they reach the right audience and drive valuable backlinks.
Identify relevant websites and influencers
Begin by researching websites, blogs, and influencers that align with your infographic’s niche or topic. Prioritize those with engaged audiences and high domain authority, as they can significantly amplify your reach. Tools like Ahrefs or SEMrush can help you identify authoritative and relevant websites.
Additionally, target influencers on social media platforms who actively share content related to your infographic’s subject. Build relationships with these key players to create collaboration opportunities and ensure your infographic reaches the right audience.
Craft a compelling introduction
When reaching out to potential collaborators, start with a concise and engaging pitch about your infographic. Clearly explain its purpose, the unique insights it offers, and how it aligns with the target audience’s interests.
Emphasize your infographic’s value—for instance, by simplifying complex data, presenting visually appealing content, or addressing trending topics relevant to their platform.
A personalized approach highlighting how the infographic benefits their readers will significantly increase their chances of sharing it.
Make sharing simple
Simplify the process of sharing your infographic by providing an embed code and a direct link to your website. This makes it easy for websites and influencers to incorporate your content into their platforms without additional effort.
An embed code ensures proper attribution and creates a seamless way for users to link back to your site, enhancing your backlink profile. Additionally, include clear instructions on how to use the infographic, making it even more convenient for collaborators to share it widely.
Leverage the power of social media
Maximize your infographic’s visibility by sharing it across social media platforms like Twitter, Instagram, LinkedIn, and Facebook. Create engaging posts that highlight key insights from the infographic to capture attention quickly.
Use targeted hashtags relevant to your topic to improve discoverability and reach niche audiences. Tag influencers, industry leaders, and relevant organizations to encourage them to engage with or share your content. Incorporate platform-specific strategies, like using Instagram Stories or LinkedIn Articles, can further amplify your reach and impact.
Pro-Tip: GrowthOG’s extensive network and proven outreach strategies can connect you with high-authority websites and influential voices in your industry. Our expertise ensures that your infographic reaches the right platforms, maximizing visibility and securing valuable backlinks.
Tracking and Measuring Success
To ensure the effectiveness of your infographic link building campaign, it’s crucial to track its performance and make data-driven adjustments for continuous improvement. Here are some tips:
Monitor links and shares
Keep a close eye on the links, shares, and retweets your infographic receives to gauge its overall reach and audience engagement. These metrics provide valuable insights into how well your content resonates and its effectiveness in sparking interest among viewers. Tracking social media activity, such as mentions and tags, can also help identify new opportunities for collaboration or further distribution.
When Buffer, a social media scheduling tool, released an infographic about the best times to post on social media, it quickly gained traction. They monitored shares across platforms like Twitter and Facebook and tracked backlinks from blogs and industry websites that found the infographic valuable for their audiences.
The campaign’s success was evident as the infographic received thousands of shares, earned backlinks from high-authority sites like HubSpot and Forbes, and drove a significant increase in traffic to Buffer’s blog. Buffer identified what worked by analysing these metrics and used those insights to optimize future campaigns.
Use backlink tools
Leverage tools like Ahrefs, SEMrush, or Moz to track the backlinks your infographic earns. These platforms allow you to assess both the quantity and quality of the links, ensuring they come from authoritative sources that align with your SEO goals.
For example, Ahrefs provides detailed reports on referring domains, anchor texts, and link growth trends, helping you identify the most effective outreach efforts.
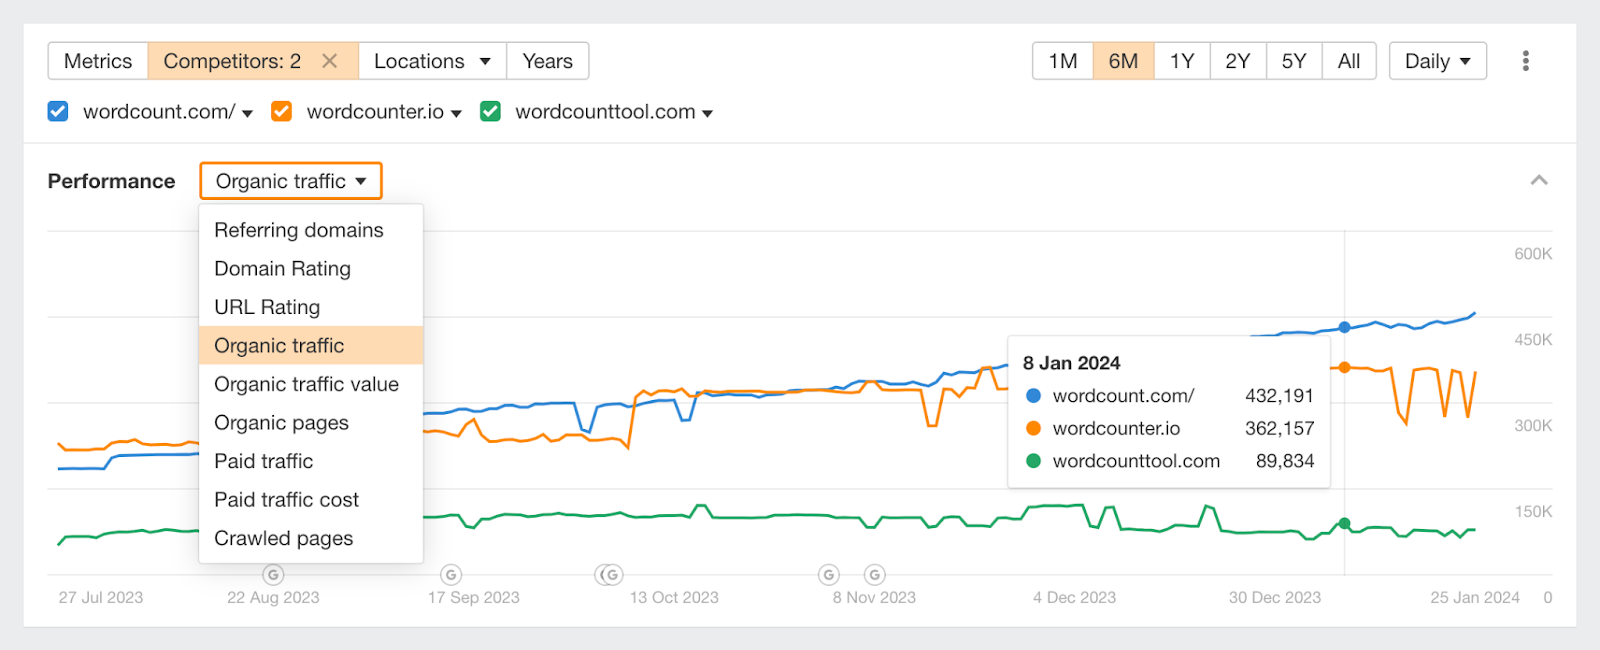
By regularly analyzing this data, you can refine your strategies to focus on high-value opportunities and maximize your campaign’s impact.
Analyze traffic and engagement
Monitor your website’s analytics using tools like Google Analytics to track the traffic generated by your infographic. Pay attention to metrics such as page views, average session duration, and bounce rates to gauge how well your infographic engages visitors.
For instance, if your infographic attracts a significant number of visitors but has a high bounce rate, it could indicate that users aren’t finding the content relevant or engaging enough.
In this case, consider optimizing the surrounding content or improving the infographic’s design to keep visitors on the page longer. By analyzing these metrics, you can adjust your strategy to improve engagement and drive more sustained traffic.
GrowthOG provides advanced tracking and optimization services to ensure your infographic campaigns continually improve. Our data-driven insights help you achieve maximum ROI and sustained success.
Tips for Success
Here are some tips to optimize your infographic link-building campaign, ensuring it reaches the right audience and drives measurable results.
- Use Ahrefs for Inspiration: Leverage tools like Ahrefs to explore popular infographics in your niche. Analyzing what’s already working can give you fresh ideas and help you identify trends that resonate with your audience.
- Create Unique and Valuable Content: Design an infographic that stands out by offering original data, insights, and fresh perspectives. The more unique and valuable your content, the more likely it attracts attention and shares.
- Adopt a Strategic Outreach Approach: When promoting your infographic, take a calculated approach by targeting the right audience. Research relevant websites and influencers and tailor your pitch to highlight the benefits of your infographic to their audience.
- Follow Up and Engage: Don’t hesitate to follow up with prospects after your initial outreach. Be polite, professional, and persistent, and keep the communication focused on how your infographic will add value to their platform. Engaging with your contacts shows commitment and can increase your chances of securing backlinks.
Over to You
Infographic link building offers a unique approach to digital marketing by combining the power of visual storytelling with strategic outreach.
Unlike traditional methods, infographics quickly capture attention, convey complex information in digestible formats, and are highly shareable across platforms. This makes them a magnet for backlinks from authoritative websites, blogs, and influencers.
Ready to take your link-building efforts to the next level? Connect with GrowthOG for a free consultation and discover how our expertise can help you achieve these results with a trusted partner.